Export annotated file as Excel output file
Export annotated file as Excel output file
Once you are done with creating your annotation file, you can export it as an Excel output file for further analysis. (see example here )
To export your annotated file:
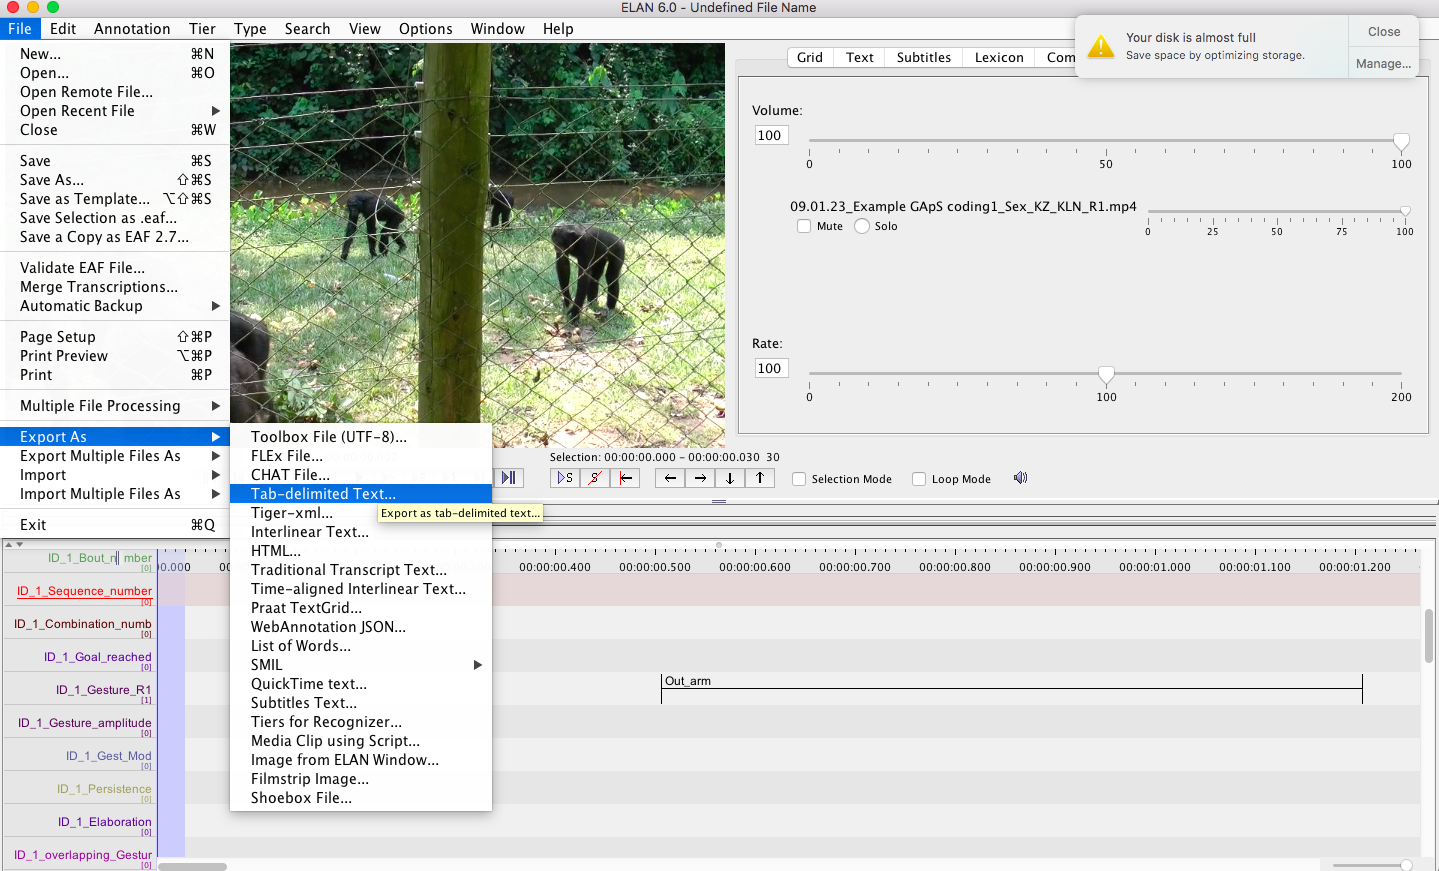
- Go to menu File > Export as > Tab-delimited Text
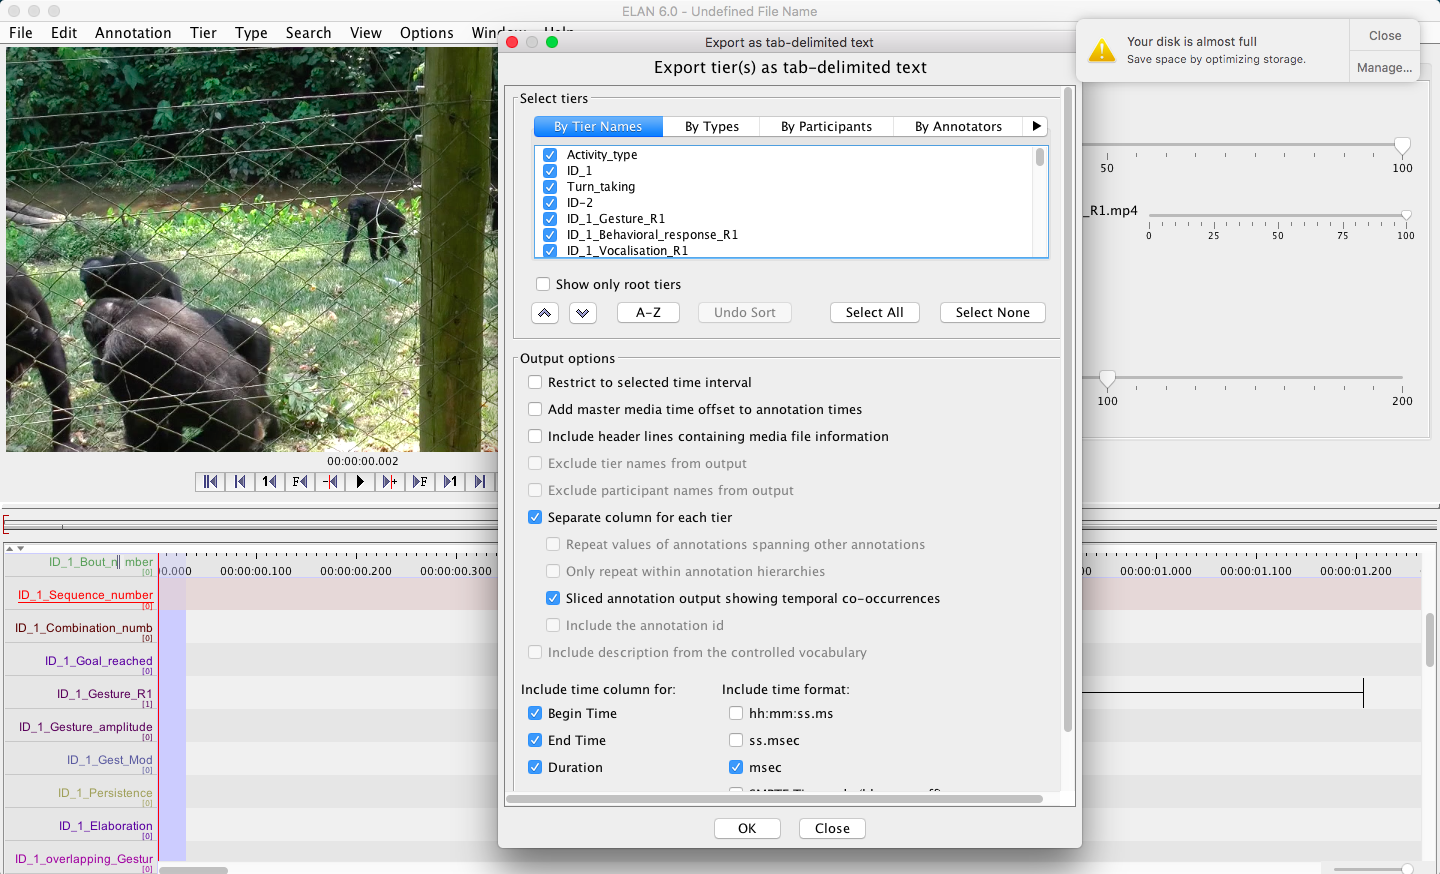
- Select the tiers you wish to export (order them as you wish to see them organized in Excel columns)
- In the output options select “Separate columns for each tier” > Select “include time column for” > tick begin time, end time, duration and msec > OK
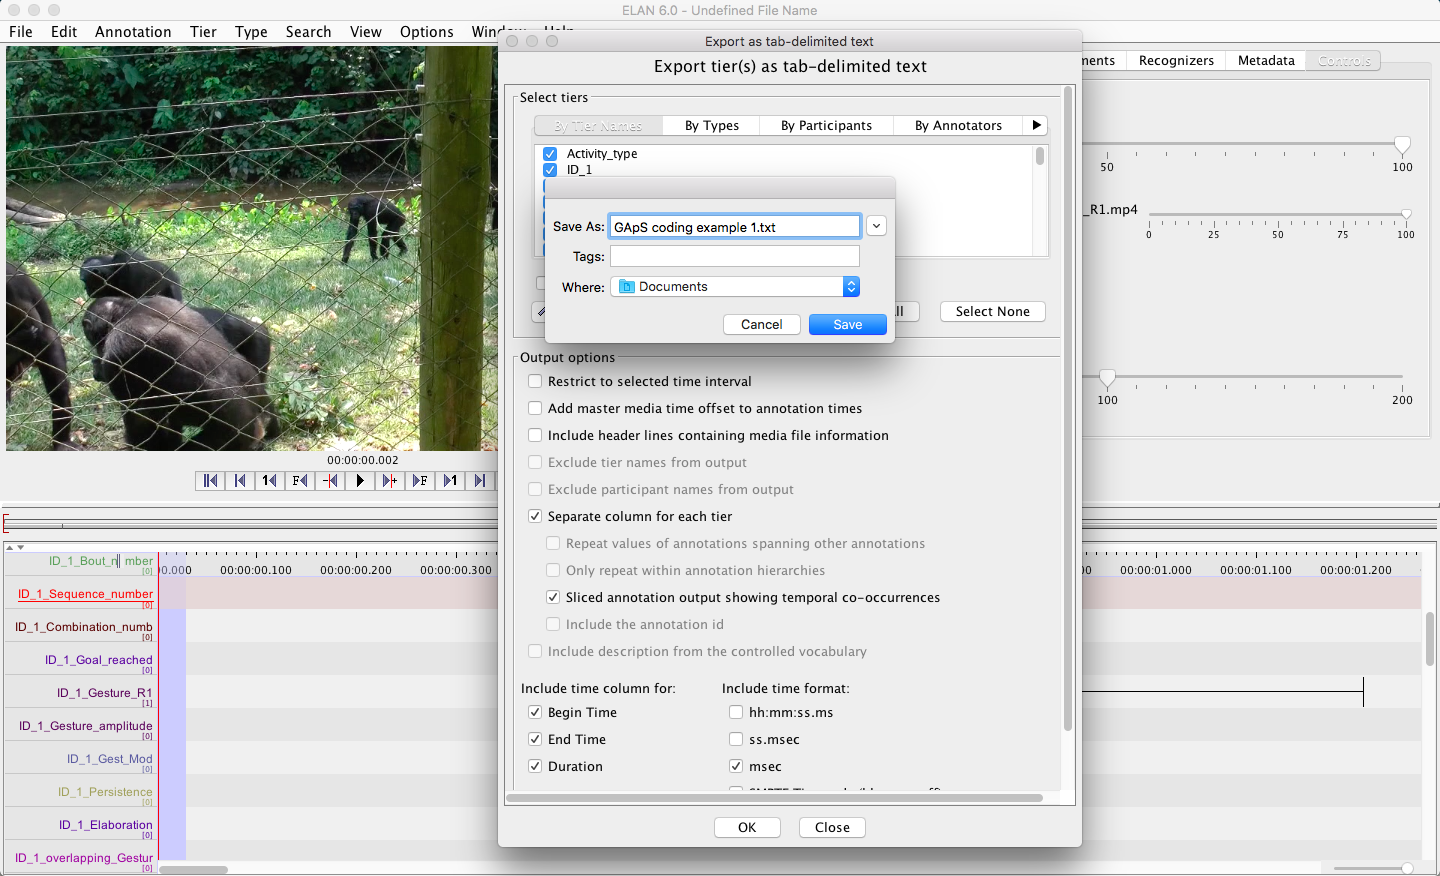
- Select destination folder and file name your output file > Select encoding format as UTF-8 > Save
Once your annotated file has been exported as a Tab-delimited Text file to the destination folder, you can open it with Excel.
Export multiple annotated files as single Excel output file
If you have several files annotated in your data set, you have the possibility to export multiple annotation files as one output file.
To do so:
- Go to menu File > Export Multiple Files As > Tab-delimited Text
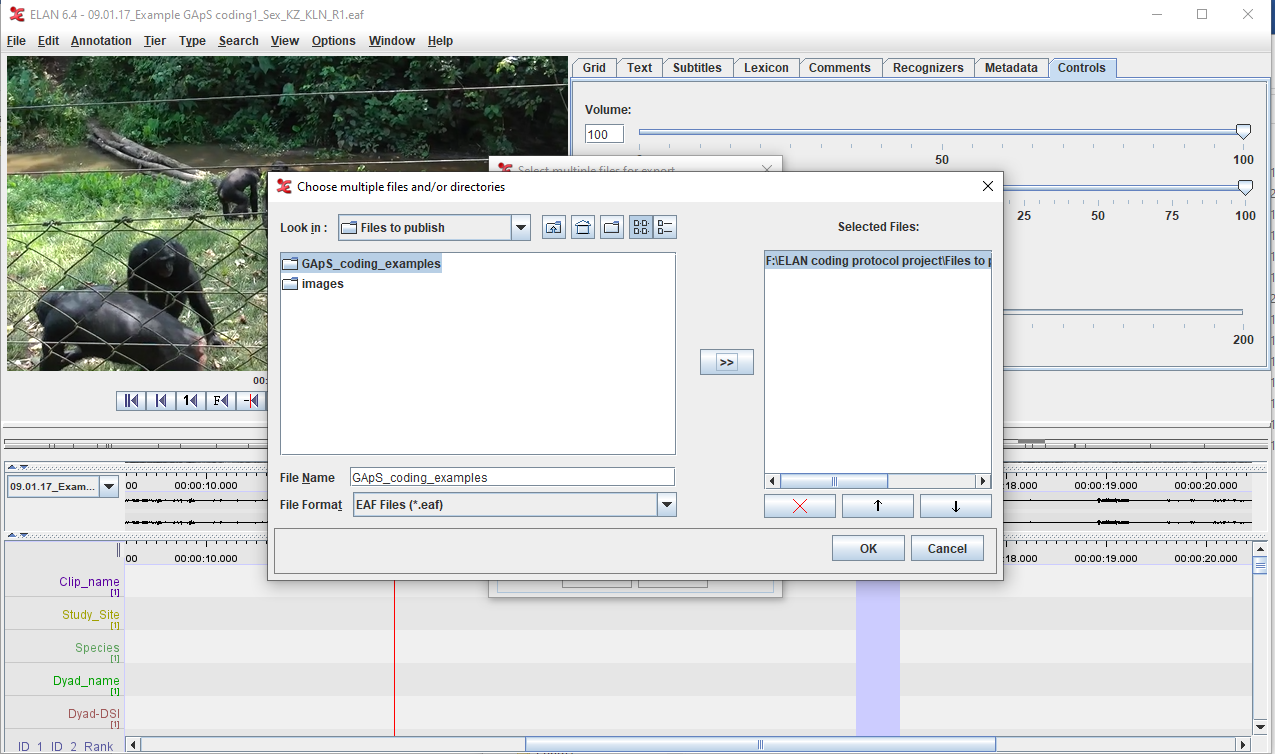
- Specify a domain for your annotated files >New Domain…
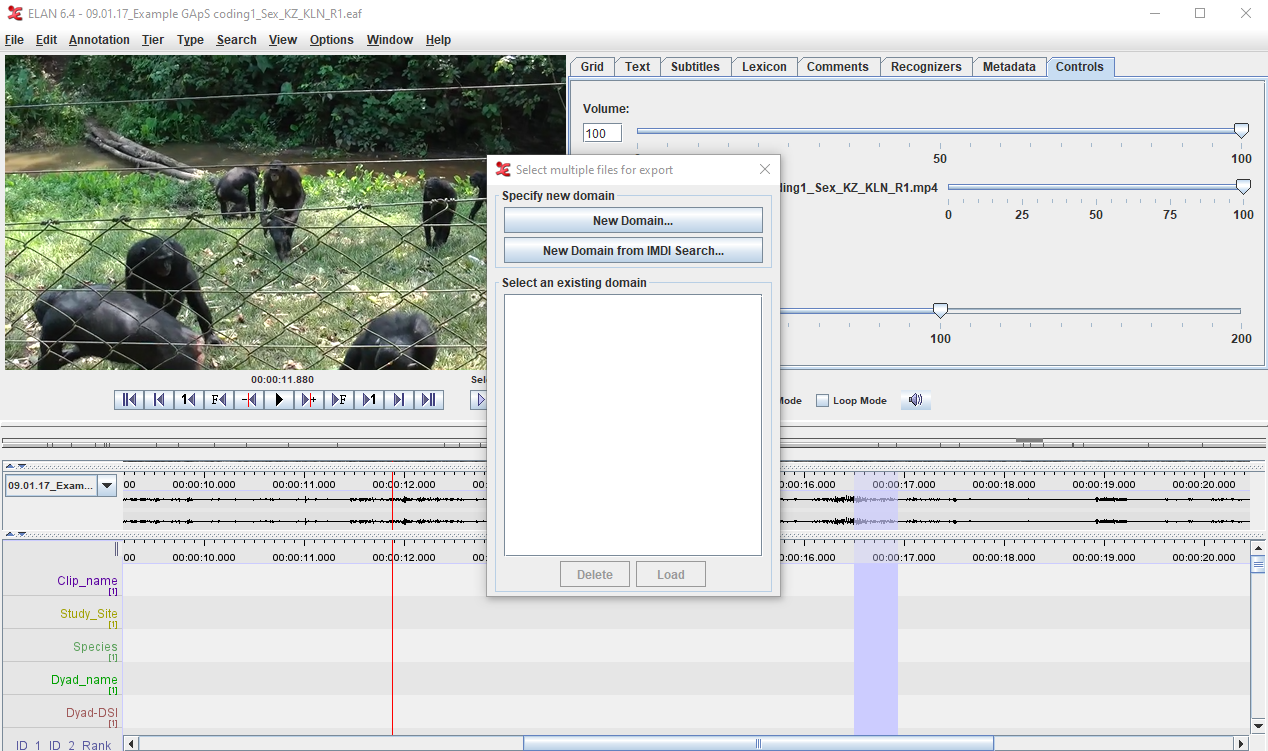
- Select the folder containing your annotated files> OK
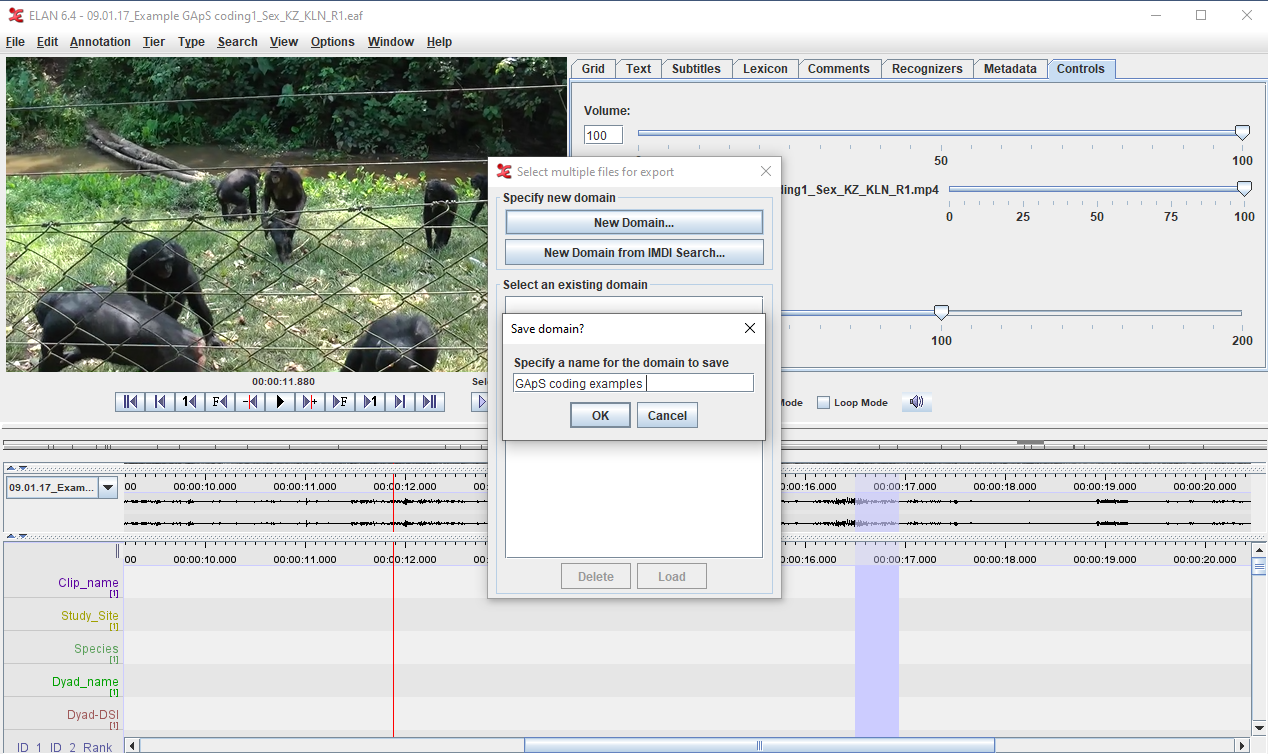
- Specify a domain to save your exported files, type a name (e.g., GApS coding examples) > OK
- Select the tiers you wish to export (order them as you wish to see them organized in Excel columns)
- In the output options select “Separate columns for each tier” > Select “include time column for” > tick begin time, end time, duration and msec > OK
Once your annotated files have been exported as a Tab-delimited Text file in the destination folder, you can open it with Excel.
Your Excel output file might require some post-hoc grooming to make it ready for further analysis. For instance, in our template, the general information related to the file, e.g., study site, species, dyad, etc. are annotated as a 3sec fixed-interval annotation, and as a consequence, these annotations will only appear in the first few rows of the corresponding columns. These annotations will thus have to be copied down across the other rows of the corresponding interaction. You might also want to give a number to the different interactions that have been annotated. You might want to copy manually the Bout, Sequence, and Combination numbers on the rows corresponding to the signals including in those (see example here) for an illustration). All these little manipulations will depend on your research question and the type of analysis you wish to perform